

What Are Inflation and Deflation?
Fundamentally, inflation is a long-term negative change in an economy in a given amount of money and an equal amount of goods or services. It is basically an increase in the prices of goods and services. And the inflation rate refers to the rate of change in price differentials over a period. For example, let’s say that you can buy a good or service for $100 today, and a year later, the amount you pay to buy the same good or service is $120, so there is an inflation of 20%. An inflation rate of 20% shows us that prices have increased by 20% compared to the previous year.
On the other hand, deflation refers to the long-term decline of prices, as opposed to inflation. In the case of deflation, there is a continuous fall in prices, which leads to reduced consumer spending and a contraction of the economy in the long run. The definitions of inflation and deflation here are related to prices, but in terms of cryptocurrencies, inflation is about quantities of supply.
Inflation and Deflation in Cryptocurrencies
Many cryptocurrencies have a limited supply. For example, Bitcoin emerged with a total supply of approximately 21 million. The limited supply cannot be increased or decreased in any way. And that means, the supply of Bitcoin will one day run out to meet the increasing demand. Ethereum, which ranks 2nd in terms of market value, is the biggest example we can give after Bitcoin. Ethereum does not have strictly a limited supply. This leads to misinformation in the minds of many investors that an unlimited number of Ethereum can be mined. Let’s look at the relationship between the supply and inflation of these two major cryptocurrencies, starting with Bitcoin.
The Relationship Between Bitcoin Supply and Inflation
Bitcoin emerged with a total supply of 21 million units. As of April 22, 2021, the total number of Bitcoin in circulation is 18.686.162 BTC. And that means that there are about 2.3 million Bitcoins left until all Bitcoins are in circulation. And all 21 million Bitcoins are expected to be in circulation by around 2140, if all conditions remain the same as today. The process will be determined by developments in Bitcoin, which is years ahead until its entire supply is in circulation, and technology. If we consider the situation with the “Ceteris Paribus” assumption (other things held constant), which is often used in economic science, the limited supply of Bitcoin makes it a deflationary asset. Theoretically, when supply does not increase at the same rate as ever-increasing demand, price is expected to rise. We see this in Bitcoin with both increasing demand and decreasing supply. Despite the increasing demand for Bitcoin, there is a gradually decreasing supply, which will run out at some point. That is why Bitcoin is preferred by many portfolio managers, professional and individual investors as an escape route from inflation.
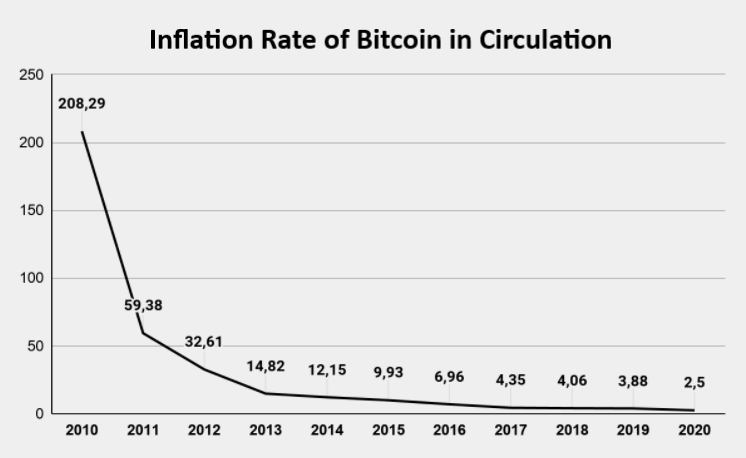
The graph below shows the inflation rates of circulating Bitcoin since 2010. As seen below, Bitcoin supply inflation is gradually decreasing. Bitcoin supply inflation, which was around 200% in 2010, declined to 2.5% in 2020. So, the supply of Bitcoin and the amount of Bitcoin mined are decreasing. It is inevitable that the graph below will reach zero point in the future (under current conditions).
The Relationship Between Ethereum Supply and Inflation
Although the supply of Ethereum is not strictly limited, it is “relatively” limited. With its current system, Ethereum uses the Proof of Work consensus mechanism. This way, validators on the network earn a fee for each transaction they verify. According to Coinmarketcap data, as of April 22, 2021, the amount of circulating Ethereum is 115.533.509 ETH. Ethereum debuted on July 30, 2015 with the Frontier protocol. The latest upgrade of Ethereum, which has experienced many protocol upgrades, the Berlin Upgrade (Update) or the Berlin Hard Fork, took place on April 15, 2021 at block 12.244.000. The table below shows all protocol upgrades of Ethereum, their dates, and the blocks in which they occurred.
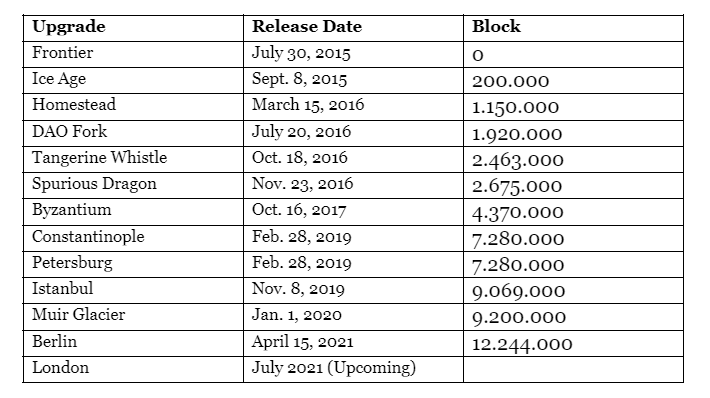
While the reward rate was 5 ETH per block until the Byzantium upgrade, it was reduced to 3 ETH from the Byzantium upgrade to the Petersburg upgrade, and to approximately 2 ETH after the Petersburg upgrade. With Ethereum 2.0, whose contract address was created towards the end of 2020, Ethereum took the first step to replace the existing Proof of Work consensus mechanism with Proof of Stake, which is known to be a more advanced and more environmentally friendly consensus mechanism. EIP-1559 is expected to take place in July 2021 before the transition to this system, where the miner concept will disappear and only validators will be involved, is completed. In EIP-1559, it was proposed to burn transfer fees (ETH). This means we will witness a new era in Ethereum.
The graph below shows the supply inflation rates since the emergence of Ethereum. As you can see below, Ethereum supply inflation is constantly falling, which means less Ethereum is mined each year. The rate, which was about 20% in 2015, decreased to about 4.56% as of 2020.
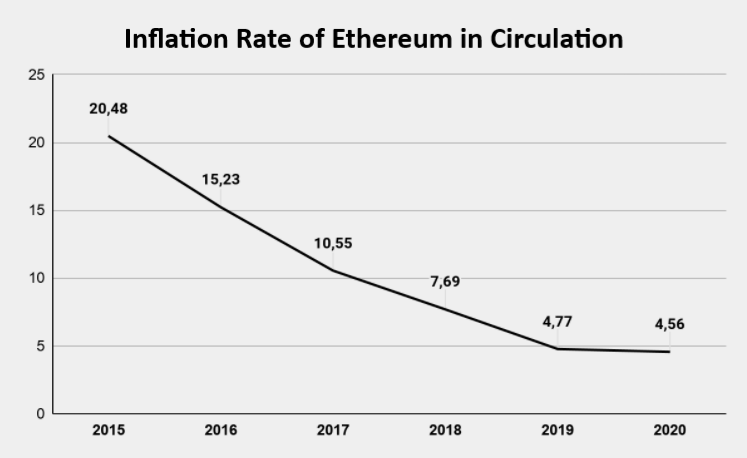
It is predicted that once all the planned upgrades are completed, the inflation rate in Ethereum will gradually decrease and after a certain level, the increase in Ethereum supply will almost cease.
The graph below shows an estimated long-term Ethereum inflation rate. Even though it does not have a certain limit, producing Ethereum will decrease to very small amounts after a point.
As a result, even though it does not have a supply limit like Bitcoin, it’s not possible to claim that Ethereum is unlimited. Considering the security, decentralization and distributed nature of a network, the role of the participants is crucial. These participants, miners or validators, are on the network for a certain reward. In cryptocurrencies with limited supply, there is a risk that there will be no incentive for miners if the block rewards are completed when the supply runs out. Therefore, the fact that the Ethereum supply is not limited is critical for the continuity of the network in the long term.


